Market Outlook
September 06, 2016
Market Cues
Domestic Indices
Chg (%)
(Pts)
(Close)
Indian markets are expected to open flat with a positive bias.
BSE Sensex
0.4
109
28,532
Nifty
0.4
35
8,810
The US markets were closed on Monday on account of Labor day.However markets
closed moderaly up on Friday after a lower than expected job data by the Labor
Mid Cap
0.5
64
13,231
department.After reporting 2,75,000 for the month of July, the August data showed
Small Cap
0.4
45
12,644
non farm payrolls at addition of only 1,51,000. Though the markets gave off some
Bankex
0.6
126
22,804
of the initial gains it still manged to close higher.
The European markets closed positvely on Friday, after a lower than expected job
Global Indices
Chg (%)
(Pts)
(Close)
data, fuelled expectations that, the US Fed might not be able to go ahead with its
Dow Jones
0.4
72
18,419
planned rate hike in the near term.
Nasdaq
0.4
23
5250
Indian markets closed Friday with a modest gain. The markets have seen broad
FTSE
(0.2)
(15)
6,879
based buying in the last few trading sessions and seems in the absence of any
negative development will continue to trade in positive territory.
Nikkei
0.7
112
17,037
Hang Seng
1.7
383
23,649
News Analysis
Shanghai Com
0.2
5
3,072
Equitas Holdings starts Small Finance Banking operations
Detailed analysis on Pg2
Advances / Declines
BSE
NSE
Investor’s Ready Reckoner
Advances
1,519
892
Key Domestic & Global Indicators
Declines
1,217
688
Stock Watch: Latest investment recommendations on 150+ stocks
Unchanged
176
86
Refer Pg5 onwards
Volumes (` Cr)
Top Picks
CMP
Target
Upside
BSE
3,735
Company
Sector
Rating
(`)
(`)
(%)
NSE
19,340
Amara Raja
Auto/Auto Ancillary Accumulate
997
1,076
7.9
HCL Tech
IT
Buy
784
1,000
27.5
HDFC Bank
Financials
Accumulate
1,284
1,350
5.1
Net Inflows (` Cr)
Net
Mtd
Ytd
Bharat Electronics
Capital Goods
Buy
1,219
1,414
16.0
FII
(382)
(382)
40,286
Equitas Holdings
Financials
Buy
180
235
30.6
MFs
107
107
10,215
Navkar Corporation Others
Buy
192
265
38.0
More Top Picks on Pg3
Top Gainers
Price (`)
Chg (%)
Key Upcoming Events
Jktyre
145
8.8
Previous
Consensus
Date
Region
Event Description
Hcc
36
8.6
Reading
Expectations
Sep 06 Euro
Eurozone GDP QoQ
0.3
0.3
Pvr
1,272
7.6
Sep 07 US
Initial Jobless Claims
263.00
264.50
Ceatltd
954
6.8
Sep 08 UK
Industrial Production YoY
1.60
1.90
Sci
70
6.6
China
Exports YoY%
(4.40)
(3.90)
India
Exports YoY%
(6.84)
6.(
Top Losers
Price (`)
Chg (%)
Cholafin
1,098
(6.0)
Eidparry
236
(4.8)
Kscl
327
(4.4)
Rtnpower
10
(3.4)
Jindalstel
82
(3.2)
As on September 02, 2016
Market Outlook
September 06, 2016
News Analysis
Equitas Starts Small Finance Banks Operations
Equitas Holdings has commenced operations of its Small Finance Bank on
Monday, from its head office in Chennai. Earlier the company had plans to start
SFB operations fro 400 branches.While the SFB will have to incur `100 cr capex
per year , the management had earlier expressed that the SFB will be profitable
from the very first year itself.
While a large expenses towards technology and other fixed cost has been incuured
initially, man power cost will grdaully go up. The new banking operations will have
to hire people experienced in the banking space to scale up.
As the much awaited SFB operations has started we belive investors will be more
keen to obesves how the cost strcture pans out. We expect the company will be
able to report 40% CAGR in its loan book , due its low base over FY16-FY18.
However, eargnings growth could be lower than the topline growth as the newly
formed bank will have to observe all the needs of RBI like maintaining SLR and
CRR. At the CMP the stock is trading at 2.4x its FY18E BV,we maintain our BUY
rating on the stock.
Economic and Political News
Railways draw up holding firm blueprint
India’s coffee exports up 18.15% in April-August
Bombardier to bid for upcoming metro rail projects
India becomes Honda’s biggest 2 wheller market
Services PMI at 42 month high in AUgust
Corporate News
Praj to tie up with PEs for its green fund; to invest in biomass based ethanol
Vedanta to investe `3000 cr to double copper capacity
Maruti to launch LCV super carry pan India in phases
Carborundum Universal expects to come out of loss in China
Market Outlook
September 06, 2016
Top Picks
Large Cap
Market Cap
CMP
Target
Upside
Company
Rationale
(` Cr)
(`)
(`)
(%)
To outpace battery industry growth due to better technological
Amara Raja Batteries
17,037
997
1,076
7.9
products leading to market share gains in both the automotive
OEM and replacement segments.
Uptick in defense capex by government, coupled with BELs
Bharat Electronics
29,256
1,219
1,414
16.0
strong market positioning, indicate good times ahead for BEL.
HCL Tech
1,10,646
784
1,000
27.5
Stock is trading at attractive valuations & factors all bad news.
Strong visibility for a robust 20% earnings trajectory, coupled
HDFC Bank
3,25,189
1,284
1,350
5.1
with high quality of earnings on account of high quality retail
business and strategic focus on highly rated corporates.
Back on the growth trend, expect a long term growth of 14% to
Infosys
2,36,827
1,031
1,370
32.9
be a US$20bn in FY2020.
Source: Company, Angel Research
Mid Cap
Market Cap
CMP
Target
Upside
Company
Rationale
(` Cr)
(`)
(`)
(%)
Favourable outlook for the AC industry to augur well for
Cooling products business which is out pacing the market
Blue Star
4,754
499
527
5.7
growth. EMPPAC division's profitability to improve once
operating environment turns around.
Strong loan growth backed by diversified loan portfolio and
Equitas Holdings
6,037
180
235
30.6
adequate CAR. ROE & ROA likely to remain decent as risk of
dilution remains low. Attractive valuations considering growth.
Expectations of above average monsoon augurs well for
Goodyear India
1,335
579
631
9.0
Goodyear India as it derives ~50% of its turnover from farm
tyre segment.
Commencement of new projects, downtrend in the interest rate
IL&FS Transport
2,395
73
93
27.7
cycle, to lead to stock re-rating
Speedier execution and speedier sales, strong revenue visibility
Mahindra Lifespace
1,773
432
522
20.8
in short-to-long run, attractive valuations
Massive capacity expansion along with rail advantage at ICD as
Navkar Corporation
2,738
192
265
38.0
well CFS augurs well for the company
Earnings boost on back of stable material prices and favourable
Radico Khaitan
1,340
101
125
24.1
pricing environment. Valuation discount to peers provides
additional comfort
Market leadership in Hindi news genre and no. 2 viewership
TV Today Network
1,806
303
363
19.9
ranking in English news genre, exit from the radio business, and
anticipated growth in ad spends by corporates to benefit the stock.
Source: Company, Angel Research
Market Outlook
September 06, 2016
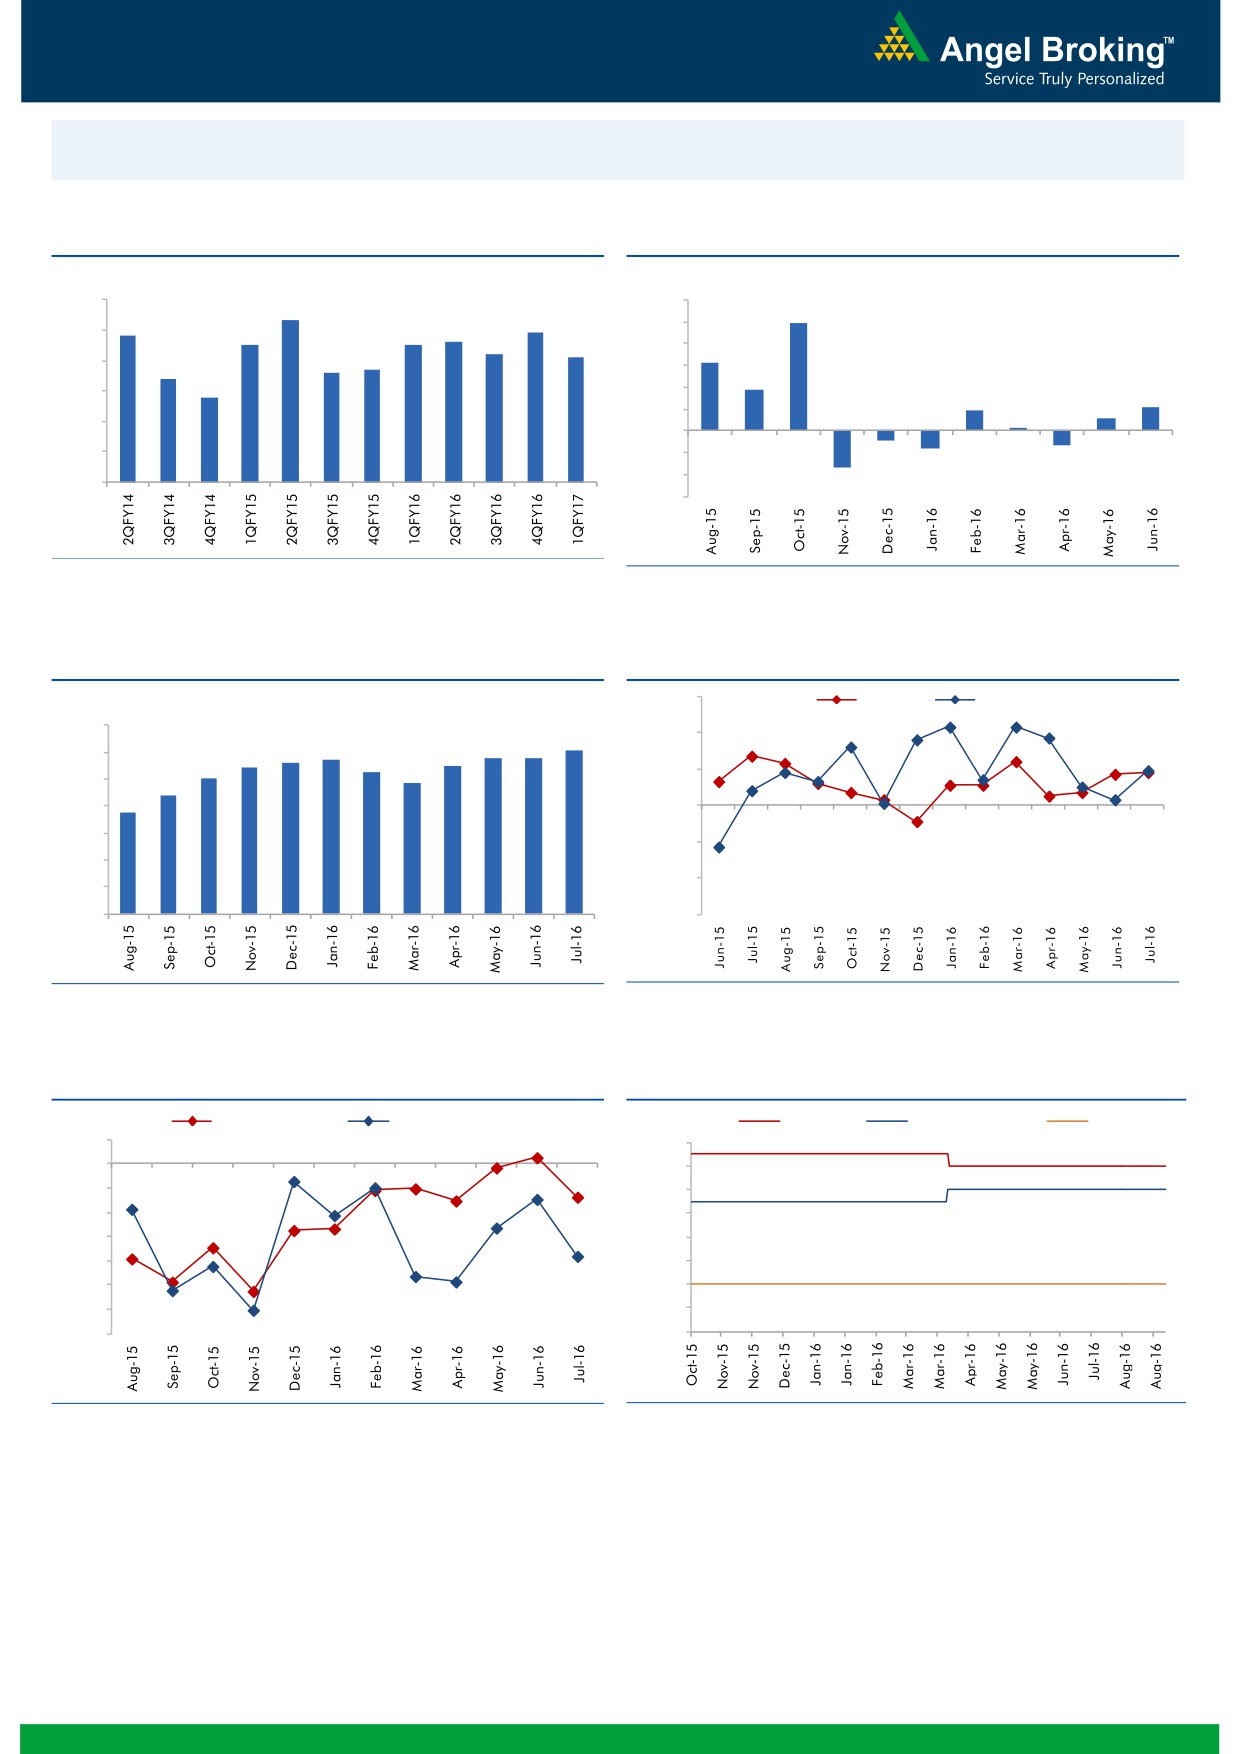
Macro watch
Exhibit 1: Quarterly GDP trends
Exhibit 2: IIP trends
(%)
(%)
9.0
8.3
12.0
9.9
7.8
7.9
10.0
8.0
7.5
7.5
7.6
7.2
7.1
8.0
6.3
6.6
6.7
7.0
6.4
6.0
3.7
5.8
4.0
2.1
6.0
1.9
1.1
2.0
0.3
5.0
-
4.0
(2.0)
(0.9)
(1.3)
(1.6)
(4.0)
3.0
(3.4)
(6.0)
Source: CSO, Angel Research
Source: MOSPI, Angel Research
Exhibit 3: Monthly CPI inflation trends
Exhibit 4: Manufacturing and services PMI
56.0
Mfg. PMI
Services PMI
(%)
7.0
6.1
54.0
5.7
5.8
5.8
5.4
5.6
5.5
6.0
5.3
5.0
4.8
52.0
5.0
4.4
3.7
4.0
50.0
3.0
48.0
2.0
46.0
1.0
-
44.0
Source: MOSPI, Angel Research
Source: Market, Angel Research; Note: Level above 50 indicates expansion
Exhibit 5: Exports and imports growth trends
Exhibit 6: Key policy rates
(%)
Exports yoy growth
Imports yoy growth
(%)
Repo rate
Reverse Repo rate
CRR
5.0
7.00
0.0
6.50
(5.0)
6.00
(10.0)
5.50
(15.0)
5.00
(20.0)
4.50
(25.0)
4.00
(30.0)
3.50
(35.0)
3.00
Source: Bloomberg, Angel Research
Source: RBI, Angel Research
Market Outlook
September 06, 2016
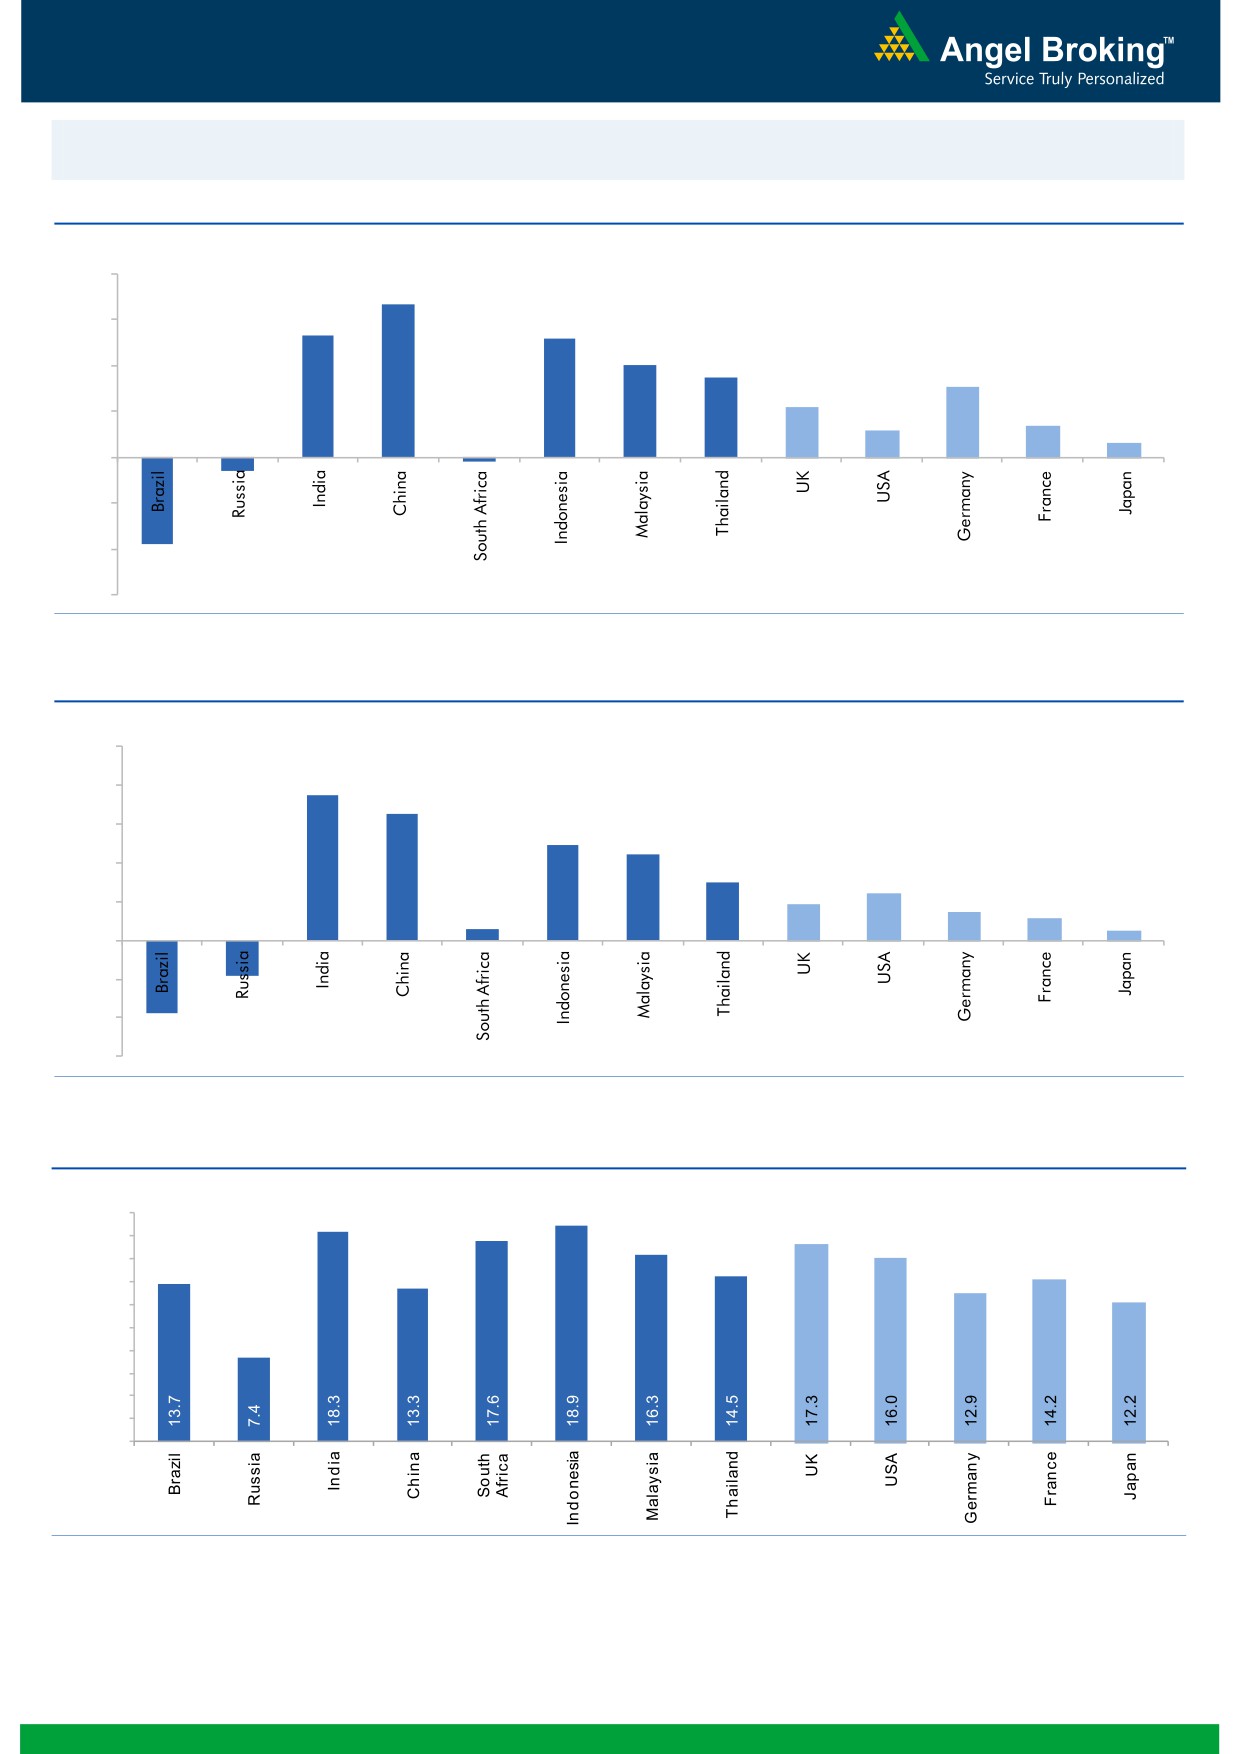
Global watch
Exhibit 1: Latest quarterly GDP Growth (%, yoy) across select developing and developed countries
(%)
8.0
6.7
6.0
5.3
5.2
4.0
3.5
4.0
3.1
2.2
1.4
2.0
1.2
0.6
-
(2.0)
(0.6)
(4.0)
(3.8)
(0.2)
(6.0)
Source: Bloomberg, Angel Research
Exhibit 2: 2016 GDP Growth projection by IMF (%, yoy) across select developing and developed countries
(%)
10.0
7.5
8.0
6.5
6.0
4.9
4.4
4.0
3.0
2.4
1.9
1.5
2.0
1.1
0.6
0.5
(3.8)
(1.8)
-
(2.0)
(4.0)
(6.0)
Source: IMF, Angel Research
Exhibit 3: One year forward P-E ratio across select developing and developed countries
(x)
20.0
18.0
16.0
14.0
12.0
10.0
8.0
6.0
4.0
2.0
-
Source: IMF, Angel Research
Market Outlook
September 06, 2016
Exhibit 4: Relative performance of indices across globe
Returns (%)
Country
Name of index
Closing price
1M
3M
1YR
Brazil
Bovespa
58,236
3.7
15.0
22.0
Russia
Micex
1,977
3.4
4.6
16.4
India
Nifty
8,775
1.6
7.3
11.3
China
Shanghai Composite
3,063
3.0
4.8
3.4
South Africa
Top 40
46,169
0.5
(3.8)
4.1
Mexico
Mexbol
47,563
2.2
3.6
9.9
Indonesia
LQ45
916
(1.1)
10.9
32.4
Malaysia
KLCI
1,671
0.3
2.5
9.0
Thailand
SET 50
978
2.3
7.3
10.4
USA
Dow Jones
18,419
0.6
3.3
12.5
UK
FTSE
6,746
0.8
9.1
11.6
Japan
Nikkei
16,927
1.7
(0.2)
(12.9)
Germany
DAX
10,534
3.8
4.3
4.2
France
CAC
4,440
2.6
0.4
(3.4)
Source: Bloomberg, Angel Research
Market Outlook
September 6, 2016
Key Upcoming Events
Result Calendar
Date
Company
Sep 07, 2016
BHEL, Areva, ONGC, GAIL, Surya Roshni
Sep 08, 2016
Jindal Steel, SAIL
Sep 09, 2016
Coal India, Nalco, GSPL
Source: Bloomberg, Angel Research
Global economic events release calendar
Bloomberg Data
Date
Time
Country Event Description
Unit
Period
Last Reported Estimated
Sep 06, 2016
2:30 PM Euro Zone
Euro-Zone GDP s.a. (QoQ)
% Change 2Q F
0.30
0.30
Sep 07, 2016
6:00 PM
US
Initial Jobless claims
Thousands Sep 3
263.00
264.50
Sep 08, 2016
2:00 PM
UK
Industrial Production (YoY)
% Change
Jul
1.60
1.90
China
Exports YoY%
% Change Aug
(4.40)
(3.90)
India
Exports YoY%
% Change Aug
(6.84)
Sep 09, 2016
5:15 PM Euro Zone
ECB announces interest rates
% Sep 8
-
-
India
Imports YoY%
% Change Aug
(19.03)
7:00 AM
China
Consumer Price Index (YoY)
% Change Aug
1.80
1.70
Sep 12, 2016
5:30 PM
India
Industrial Production YoY
% Change
Jul
2.10
Sep 13, 2016
2:00 PM
UK
CPI (YoY)
% Change Aug
0.60
7:30 AM
China
Industrial Production (YoY)
% Change Aug
6.00
6.20
Sep 14, 2016
2:00 PM
UK
Jobless claims change
% Change Aug
(8.60)
12:00 PM
India
Monthly Wholesale Prices YoY%
% Change Aug
3.55
Source: Bloomberg, Angel Research
Stock Watch
September 06, 2016
Company Name
Reco
CMP
Target
Mkt Cap
Sales ( Čcr )
OPM(%)
EPS (Č)
PER(x)
P/BV(x)
RoE(%)
EV/Sales(x)
(Č)
Price ( Č)
( Č cr )
FY17E FY18E
FY17E
FY18E
FY17E
FY18E
FY17E
FY18E
FY17E
FY18E
FY17E
FY18E
FY17E
FY18E
Agri / Agri Chemical
Rallis
Neutral
226
-
4,398
1,937
2,164
13.3
14.3
9.0
11.0
25.1
20.6
4.4
3.8
18.4
19.8
2.3
2.0
United Phosphorus
Accumulate
635
684
27,227
15,176
17,604
18.5
18.5
37.4
44.6
17.0
14.2
3.3
2.8
21.4
21.2
1.9
1.6
Auto & Auto Ancillary
Ashok Leyland
Buy
83
111
23,692
22,407
26,022
10.6
10.6
5.2
6.4
16.0
13.0
3.6
3.1
23.6
24.7
1.1
1.0
Bajaj Auto
Neutral
3,000
-
86,806
25,093
27,891
19.5
19.2
143.9
162.5
20.8
18.5
5.9
5.0
30.3
29.4
3.2
2.8
Bharat Forge
Neutral
874
-
20,350
7,726
8,713
20.5
21.2
35.3
42.7
24.8
20.5
4.6
4.1
18.9
20.1
2.7
2.3
Eicher Motors
Neutral
22,817
-
61,974
16,583
20,447
17.5
18.0
598.0
745.2
38.2
30.6
13.0
9.9
41.2
38.3
3.6
2.8
Gabriel India
Neutral
120
-
1,717
1,544
1,715
9.0
9.3
5.4
6.3
22.1
19.0
4.2
3.7
18.9
19.5
1.1
0.9
Hero Motocorp
Neutral
3,579
-
71,459
31,253
35,198
15.3
15.0
172.3
192.1
20.8
18.6
7.6
6.5
38.9
37.0
2.2
1.9
Jamna Auto Industries Neutral
222
-
1,774
1,486
1,620
9.8
9.9
15.0
17.2
14.8
12.9
3.2
2.7
21.8
21.3
1.3
1.1
L G Balakrishnan & Bros Neutral
485
-
761
1,302
1,432
11.6
11.9
43.7
53.0
11.1
9.1
1.6
1.4
13.8
14.2
0.7
0.6
Mahindra and Mahindra Neutral
1,469
-
91,229
46,534
53,077
11.6
11.7
67.3
78.1
21.8
18.8
3.6
3.1
15.4
15.8
1.9
1.7
Maruti
Neutral
5,159
-
155,828
69,186
82,217
14.7
14.4
198.5
241.4
26.0
21.4
5.1
4.1
20.2
20.0
2.0
1.6
Minda Industries
Neutral
1,407
-
2,232
2,728
3,042
9.0
9.1
68.2
86.2
20.6
16.3
4.7
3.7
23.8
24.3
0.9
0.8
Motherson Sumi
Neutral
321
-
42,420
45,896
53,687
7.8
8.3
13.0
16.1
24.6
19.9
7.9
6.3
34.7
35.4
1.0
0.8
Rane Brake Lining
Neutral
780
-
618
511
562
11.3
11.5
28.1
30.9
27.8
25.2
4.2
3.9
15.3
15.0
1.3
1.2
Setco Automotive
Neutral
44
-
582
741
837
13.0
13.0
15.2
17.0
2.9
2.6
0.5
0.4
15.8
16.3
1.2
1.1
Tata Motors
Neutral
550
-
158,738
300,209
338,549
8.9
8.4
42.7
54.3
12.9
10.1
2.1
1.7
15.6
17.2
0.6
0.6
TVS Motor
Neutral
332
-
15,766
13,390
15,948
6.9
7.1
12.8
16.5
26.0
20.1
6.5
5.1
26.3
27.2
1.2
1.0
Amara Raja Batteries
Accumulate
997
1,076
17,037
5,717
6,733
18.7
18.9
38.4
48.9
26.0
20.4
6.5
5.3
25.3
24.8
2.8
2.3
Exide Industries
Neutral
187
-
15,899
7,439
8,307
15.0
15.0
8.1
9.3
23.1
20.1
3.2
2.9
14.3
16.7
1.8
1.6
Apollo Tyres
Neutral
194
-
9,893
12,877
14,504
14.3
13.9
21.4
23.0
9.1
8.5
1.4
1.2
16.4
15.2
0.9
0.9
Ceat
Buy
954
1,119
3,858
7,524
8,624
13.0
12.7
131.1
144.3
7.3
6.6
1.3
1.1
19.8
18.6
0.6
0.5
JK Tyres
Neutral
145
-
3,299
7,455
8,056
15.0
15.0
21.8
24.5
6.7
5.9
1.4
1.1
22.8
21.3
0.6
0.5
Swaraj Engines
Neutral
1,162
-
1,443
660
810
15.2
16.4
54.5
72.8
21.3
16.0
6.6
6.0
31.5
39.2
2.0
1.6
Subros
Neutral
105
-
630
1,488
1,681
11.7
11.9
6.4
7.2
16.4
14.6
1.7
1.6
10.8
11.4
0.7
0.6
Indag Rubber
Neutral
186
-
489
286
326
19.8
16.8
11.7
13.3
15.9
14.0
2.7
2.5
17.8
17.1
1.4
1.2
Capital Goods
ACE
Neutral
45
-
447
709
814
4.1
4.6
1.4
2.1
32.3
21.5
1.3
1.3
4.4
6.0
0.8
0.7
BEML
Accumulate
1,078
1,157
4,489
3,451
4,055
6.3
9.2
31.4
57.9
34.3
18.6
2.1
1.9
6.3
10.9
1.4
1.2
Bharat Electronics
Buy
1,219
1,414
29,256
8,137
9,169
16.8
17.2
58.7
62.5
20.8
19.5
3.2
2.9
44.6
46.3
2.6
2.3
Stock Watch
September 06, 2016
Company Name
Reco
CMP
Target
Mkt Cap
Sales ( Čcr )
OPM(%)
EPS (Č)
PER(x)
P/BV(x)
RoE(%)
EV/Sales(x)
(Č)
Price ( Č)
( Č cr )
FY17E
FY18E
FY17E
FY18E
FY17E
FY18E
FY17E
FY18E
FY17E
FY18E
FY17E
FY18E
FY17E
FY18E
Capital Goods
Voltas
Neutral
390
-
12,909
6,511
7,514
7.9
8.7
12.9
16.3
30.2
23.9
5.4
4.8
16.7
18.5
1.7
1.5
BGR Energy
Neutral
114
-
821
16,567
33,848
6.0
5.6
7.8
5.9
14.6
19.3
0.8
0.8
4.7
4.2
0.2
0.1
BHEL
Neutral
137
-
33,434
28,797
34,742
-
2.8
2.3
6.9
59.4
19.8
1.0
1.0
1.3
4.8
0.8
0.6
Blue Star
Accumulate
499
527
4,754
4,351
5,024
6.4
7.1
17.2
20.6
29.0
24.2
18.9
15.7
23.1
24.1
1.1
1.0
Crompton Greaves
Neutral
82
-
5,117
5,777
6,120
5.9
7.0
3.3
4.5
24.7
18.1
1.1
1.0
4.4
5.9
0.8
0.7
Greaves Cotton
Neutral
136
-
3,313
1,755
1,881
16.8
16.9
7.8
8.5
17.4
16.0
3.5
3.2
20.6
20.9
1.6
1.4
Inox Wind
Buy
192
286
4,253
5,605
6,267
15.7
16.4
24.8
30.0
7.7
6.4
2.2
1.6
25.9
24.4
0.8
0.7
KEC International
Neutral
135
-
3,481
9,294
10,186
7.9
8.1
9.9
11.9
13.7
11.4
2.0
1.7
15.6
16.3
0.6
0.6
Thermax
Neutral
821
-
9,782
5,421
5,940
7.3
7.3
25.7
30.2
31.9
27.2
3.9
3.5
12.2
13.1
1.7
1.5
VATech Wabag
Buy
565
681
3,079
3,136
3,845
8.9
9.1
26.0
35.9
21.7
15.7
2.7
2.3
13.4
15.9
0.9
0.7
Cement
ACC
Neutral
1,668
-
31,325
11,225
13,172
13.2
16.9
44.5
75.5
37.5
22.1
3.6
3.3
11.2
14.2
2.8
2.4
Ambuja Cements
Neutral
276
-
54,863
9,350
10,979
18.2
22.5
5.8
9.5
47.6
29.1
4.0
3.6
10.2
12.5
5.9
5.0
India Cements
Neutral
152
-
4,668
4,364
4,997
18.5
19.2
7.9
11.3
19.2
13.5
1.4
1.3
8.0
8.5
1.8
1.6
JK Cement
Neutral
783
-
5,473
4,398
5,173
15.5
17.5
31.2
55.5
25.1
14.1
3.0
2.6
12.0
15.5
1.8
1.5
J K Lakshmi Cement
Neutral
460
-
5,418
2,913
3,412
14.5
19.5
7.5
22.5
61.4
20.5
3.8
3.2
12.5
18.0
2.4
2.0
Orient Cement
Neutral
205
-
4,190
2,114
2,558
18.5
20.5
8.1
11.3
25.3
18.1
3.7
3.2
9.0
14.0
2.6
2.1
UltraTech Cement
Neutral
4,088
-
112,179
25,768
30,385
21.0
23.5
111.0
160.0
36.8
25.6
4.7
4.1
13.5
15.8
4.5
3.7
Construction
ITNL
Buy
73
93
2,395
8,946
10,017
31.0
31.6
8.1
9.1
9.0
8.0
0.3
0.3
4.2
5.0
3.6
3.3
KNR Constructions
Accumulate
701
802
1,973
1,385
1,673
14.7
14.0
41.2
48.5
17.0
14.5
3.2
2.7
14.9
15.2
1.5
1.2
Larsen & Toubro
Accumulate
1,502
1,700
140,025
67,665
77,249
10.7
11.5
57.3
71.2
26.2
21.1
2.4
2.3
12.6
14.3
2.3
1.9
Gujarat Pipavav Port
Neutral
186
-
8,994
705
788
52.2
51.7
5.0
5.6
37.2
33.2
3.7
3.3
11.2
11.2
12.4
10.6
Nagarjuna Const.
Neutral
87
-
4,817
8,842
9,775
9.1
8.8
5.3
6.4
16.4
13.5
1.3
1.2
8.2
9.1
0.7
0.6
PNC Infratech
Accumulate
121
129
3,112
2,350
2,904
13.4
13.7
48.0
42.0
2.5
2.9
0.5
0.4
16.8
13.2
1.4
1.2
Simplex Infra
Neutral
326
-
1,612
6,829
7,954
10.5
10.5
31.4
37.4
10.4
8.7
1.1
1.0
9.9
13.4
0.7
0.6
Power Mech Projects
Neutral
481
-
708
1,801
2,219
12.7
14.6
72.1
113.9
6.7
4.2
1.2
1.0
16.8
11.9
0.4
0.3
Sadbhav Engineering
Neutral
290
-
4,968
3,598
4,140
10.3
10.6
9.0
11.9
32.2
24.3
3.4
3.0
9.9
11.9
1.7
1.4
NBCC
Neutral
245
-
14,676
7,428
9,549
7.9
8.6
8.2
11.0
29.8
22.2
1.5
1.2
28.2
28.7
1.7
1.3
MEP Infra
Neutral
43
-
700
1,877
1,943
30.6
29.8
3.0
4.2
14.4
10.3
6.9
4.7
0.6
0.6
1.8
1.6
SIPL
Neutral
107
-
3,783
1,036
1,252
65.5
66.2
(8.4)
(5.6)
4.0
4.6
(22.8)
(15.9)
11.9
9.9
Stock Watch
September 06, 2016
Company Name
Reco
CMP
Target
Mkt Cap
Sales ( Čcr )
OPM(%)
EPS (Č)
PER(x)
P/BV(x)
RoE(%)
EV/Sales(x)
(Č)
Price ( Č)
( Č cr )
FY17E
FY18E
FY17E
FY18E
FY17E
FY18E
FY17E
FY18E
FY17E
FY18E
FY17E
FY18E
FY17E
FY18E
Construction
Engineers India
Neutral
270
-
9,086
1,725
1,935
16.0
19.1
11.4
13.9
23.7
19.4
3.3
3.2
13.4
15.3
4.2
3.8
Financials
Axis Bank
Neutral
599
-
143,003
58,081
66,459
3.5
3.5
32.4
44.6
18.5
13.4
2.4
2.1
13.6
16.5
-
-
Bank of Baroda
Neutral
166
-
38,341
19,980
23,178
1.8
1.8
11.5
17.3
14.5
9.6
1.7
1.4
8.3
10.1
-
-
Canara Bank
Neutral
281
-
15,282
15,225
16,836
1.8
1.8
14.5
28.0
19.4
10.1
1.3
1.1
5.8
8.5
-
-
Dewan Housing Finance Neutral
287
-
8,383
2,225
2,688
2.9
2.9
29.7
34.6
9.7
8.3
1.6
1.3
16.1
16.8
-
-
Equitas Holdings
Buy
180
235
6,037
939
1,281
11.7
11.5
5.8
8.2
31.0
22.0
2.7
2.4
10.9
11.5
-
-
Federal Bank
Neutral
70
-
12,036
9,353
10,623
2.9
2.9
4.4
5.8
15.9
12.1
1.5
1.4
9.5
11.0
-
-
HDFC
Neutral
1,438
-
227,343
11,475
13,450
3.4
3.4
45.3
52.5
31.7
27.4
6.1
5.4
20.2
20.5
-
-
HDFC Bank
Accumulate
1,284
1,350
325,189
46,097
55,433
4.5
4.5
58.4
68.0
22.0
18.9
3.9
3.2
18.8
18.6
-
-
ICICI Bank
Neutral
261
-
152,025
39,029
45,903
3.3
3.3
16.7
16.3
15.7
16.0
1.9
1.8
10.1
12.4
-
-
LIC Housing Finance
Neutral
575
-
29,008
3,712
4,293
2.6
2.5
39.0
46.0
14.7
12.5
2.8
2.4
19.9
20.1
-
-
Punjab Natl.Bank
Neutral
126
-
24,771
23,532
23,595
2.3
2.4
6.8
12.6
18.6
10.0
2.9
2.0
3.3
6.5
-
-
South Ind.Bank
Neutral
22
-
3,011
6,435
7,578
2.5
2.5
2.7
3.1
8.3
7.2
1.1
0.9
10.1
11.2
-
-
St Bk of India
Neutral
254
-
197,446
88,650
98,335
2.6
2.6
13.5
18.8
18.8
13.5
1.8
1.6
7.0
8.5
-
-
Union Bank
Neutral
140
-
9,631
13,450
14,925
2.3
2.3
25.5
34.5
5.5
4.1
0.8
0.7
7.5
10.2
-
-
Yes Bank
Neutral
1,388
-
58,413
8,978
11,281
3.3
3.4
74.0
90.0
18.8
15.4
3.6
3.0
17.0
17.2
-
-
FMCG
Asian Paints
Neutral
1,166
-
111,847
17,128
18,978
16.8
16.4
19.1
20.7
61.1
56.3
21.2
20.0
34.8
35.5
6.4
5.8
Britannia
Neutral
3,358
-
40,290
9,795
11,040
14.6
14.9
80.3
94.0
41.8
35.7
17.2
13.3
41.2
-
4.0
3.5
Colgate
Neutral
952
-
25,904
4,605
5,149
23.4
23.4
23.8
26.9
40.0
35.4
22.2
17.3
64.8
66.8
5.6
4.9
Dabur India
Neutral
297
-
52,194
8,315
9,405
19.8
20.7
8.1
9.2
36.6
32.3
10.2
8.5
31.6
31.0
5.9
5.2
GlaxoSmith Con*
Neutral
6,260
-
26,325
4,350
4,823
21.2
21.4
179.2
196.5
34.9
31.9
9.3
7.9
27.1
26.8
5.4
4.8
Godrej Consumer
Neutral
1,564
-
53,271
10,235
11,428
18.4
18.6
41.1
44.2
38.1
35.4
8.4
7.1
24.9
24.8
5.3
4.7
HUL
Neutral
920
-
199,078
35,252
38,495
17.6
17.4
20.4
21.9
45.0
42.0
37.0
32.5
82.2
77.3
5.5
5.0
ITC
Accumulate
262
283
316,798
40,059
44,439
39.0
39.2
9.1
10.1
28.9
26.0
7.9
6.9
27.2
26.5
7.4
6.6
Marico
Neutral
291
-
37,505
6,430
7,349
18.8
19.5
6.4
7.7
45.4
37.8
13.7
11.5
33.2
32.5
5.6
4.9
Nestle*
Neutral
6,449
-
62,181
10,073
11,807
20.7
21.5
124.8
154.2
51.7
41.8
21.2
19.1
34.8
36.7
6.0
5.1
Tata Global
Neutral
142
-
8,937
8,675
9,088
9.8
9.8
7.4
8.2
19.1
17.3
2.2
2.1
7.9
8.1
0.9
0.9
Procter & Gamble
Accumulate
6,594
7,369
21,405
2,939
3,342
23.2
23.0
146.2
163.7
45.1
40.3
101.0
96.8
25.3
23.5
6.8
5.9
Hygiene
IT
HCL Tech^
Buy
784
1,000
110,646
49,242
57,168
20.5
20.5
55.7
64.1
14.1
12.2
2.9
2.2
20.3
17.9
2.1
1.7
Stock Watch
September 06, 2016
Company Name
Reco
CMP
Target
Mkt Cap
Sales ( Čcr )
OPM(%)
EPS (Č)
PER(x)
P/BV(x)
RoE(%)
EV/Sales(x)
(Č)
Price ( Č)
( Č cr )
FY17E FY18E
FY17E
FY18E
FY17E
FY18E
FY17E
FY18E
FY17E
FY18E
FY17E
FY18E
FY17E
FY18E
IT
Infosys
Buy
1,031
1,370
236,827
69,934
79,025
27.5
27.5
64.8
72.0
15.9
14.3
3.5
3.2
22.0
22.3
2.8
2.5
TCS
Buy
2,514
3,004
495,267
121,684
136,286
27.3
27.3
135.0
150.1
18.6
16.8
6.2
5.7
33.2
33.9
3.8
3.4
Tech Mahindra
Buy
471
700
45,754
30,347
33,685
17.0
17.0
37.5
41.3
12.6
11.4
2.7
2.4
21.8
20.7
1.2
1.1
Wipro
Buy
483
680
119,422
51,631
55,822
21.7
17.9
35.9
36.9
13.5
13.1
2.8
2.6
19.0
18.1
2.0
1.8
Media
D B Corp
Neutral
406
-
7,468
2,297
2,590
27.4
28.2
21.0
23.4
19.4
17.4
4.5
3.9
23.7
23.1
3.1
2.6
HT Media
Neutral
85
-
1,971
2,693
2,991
12.6
12.9
7.9
9.0
10.7
9.4
0.9
0.8
7.8
8.3
0.3
0.2
Jagran Prakashan
Accumulate
195
205
6,381
2,355
2,635
28.0
28.0
9.9
10.8
19.7
18.1
3.9
3.4
21.7
21.7
2.7
2.4
Sun TV Network
Neutral
470
-
18,538
2,850
3,265
70.1
71.0
26.2
30.4
18.0
15.5
4.6
4.1
24.3
25.6
6.1
5.2
Hindustan Media
Neutral
280
-
2,052
1,016
1,138
24.3
25.2
27.3
30.1
10.2
9.3
2.0
1.7
16.2
15.8
1.3
1.2
Ventures
TV Today Network
Buy
303
363
1,806
637
743
27.5
27.5
18.4
21.4
16.5
14.2
2.9
2.4
17.4
17.2
2.4
2.0
Metals & Mining
Coal India
Neutral
333
-
210,019
84,638
94,297
21.4
22.3
24.5
27.1
13.6
12.3
5.7
5.4
42.6
46.0
2.0
1.8
Hind. Zinc
Neutral
227
-
96,084
14,252
18,465
55.9
48.3
15.8
21.5
14.4
10.6
2.3
2.1
17.0
20.7
6.7
5.2
Hindalco
Neutral
157
-
32,493
107,899
112,095
7.4
8.2
9.2
13.0
17.1
12.1
0.8
0.8
4.8
6.6
0.8
0.8
JSW Steel
Neutral
1,775
-
42,895
53,201
58,779
16.1
16.2
130.6
153.7
13.6
11.6
1.8
1.6
14.0
14.4
1.6
1.4
NMDC
Neutral
108
-
42,660
6,643
7,284
44.4
47.7
7.1
7.7
15.2
14.0
1.3
1.3
8.8
9.2
4.2
3.8
SAIL
Neutral
48
-
19,886
47,528
53,738
(0.7)
2.1
(1.9)
2.6
18.5
0.5
0.5
(1.6)
3.9
1.3
1.2
Vedanta
Neutral
172
-
51,067
71,744
81,944
19.2
21.7
13.4
20.1
12.9
8.6
1.1
1.0
8.4
11.3
1.1
0.8
Tata Steel
Neutral
374
-
36,294
121,374
121,856
7.2
8.4
18.6
34.3
20.1
10.9
1.3
1.2
6.1
10.1
0.9
0.9
Oil & Gas
Cairn India
Neutral
202
-
37,797
9,127
10,632
4.3
20.6
8.8
11.7
22.9
17.2
0.7
0.7
3.3
4.2
5.6
4.6
GAIL
Neutral
394
-
50,022
56,220
65,198
9.3
10.1
27.1
33.3
14.6
11.8
1.3
1.2
9.3
10.7
1.1
0.9
ONGC
Neutral
239
-
204,348
137,222
152,563
15.0
21.8
19.5
24.1
12.3
9.9
1.1
1.0
8.5
10.1
1.8
1.6
Indian Oil Corp
Neutral
573
-
139,231
373,359
428,656
5.9
5.5
54.0
59.3
10.6
9.7
1.6
1.5
16.0
15.6
0.5
0.5
Reliance Industries
Neutral
1,013
-
328,411
301,963
358,039
12.1
12.6
87.7
101.7
11.6
10.0
1.2
1.1
10.7
11.3
1.6
1.3
Pharmaceuticals
Alembic Pharma
Neutral
621
-
11,710
3,483
4,083
20.2
21.4
24.3
30.4
25.6
20.4
5.8
4.6
25.5
25.3
3.3
2.7
Aurobindo Pharma
Accumulate
779
877
45,585
15,720
18,078
23.7
23.7
41.4
47.3
18.8
16.5
4.9
3.8
29.6
26.1
3.1
2.7
Sanofi India*
Neutral
4,475
-
10,306
2,357
2,692
17.3
17.3
153.5
169.2
29.2
26.5
4.9
4.0
25.8
28.4
4.1
3.3
Cadila Healthcare
Neutral
385
-
39,363
11,126
13,148
22.0
22.0
17.1
20.0
22.5
19.2
5.8
4.6
28.8
26.6
3.5
2.9
Cipla
Sell
578
490
46,430
15,378
18,089
17.4
18.4
21.6
27.2
26.8
21.2
3.5
3.0
13.7
15.2
3.2
2.7
Dr Reddy's
Neutral
3,123
-
53,254
16,043
18,119
23.1
24.7
126.0
157.8
24.8
19.8
3.7
3.2
15.7
17.1
3.3
2.9
Stock Watch
September 06, 2016
Company Name
Reco
CMP
Target
Mkt Cap
Sales ( Čcr )
OPM(%)
EPS (Č)
PER(x)
P/BV(x)
RoE(%)
EV/Sales(x)
(Č)
Price ( Č)
( Č cr )
FY17E FY18E
FY17E
FY18E
FY17E
FY18E
FY17E
FY18E
FY17E
FY18E
FY17E
FY18E
FY17E
FY18E
Pharmaceuticals
Dishman Pharma
Sell
174
45
2,814
1,718
1,890
22.7
22.8
9.5
11.3
18.4
15.4
1.8
1.6
10.1
10.9
2.1
1.8
GSK Pharma*
Neutral
2,977
-
25,219
3,528
3,811
16.6
18.8
51.8
59.4
57.5
50.1
15.4
15.3
26.3
30.6
6.9
6.5
Indoco Remedies
Sell
323
225
2,975
1,112
1,289
18.2
18.2
13.2
15.6
24.5
20.7
4.4
3.7
19.2
19.2
2.8
2.4
Ipca labs
Accumulate
541
613
6,829
3,303
3,799
15.3
15.3
17.3
19.7
31.3
27.5
2.7
2.5
9.1
9.4
2.2
1.9
Lupin
Buy
1,516
1,809
68,352
15,912
18,644
26.4
26.7
58.1
69.3
26.1
21.9
5.1
4.2
21.4
20.9
4.4
3.6
Sun Pharma
Buy
782
944
188,228
31,129
35,258
30.0
30.9
28.0
32.8
27.9
23.8
4.3
3.6
18.7
18.9
5.6
4.8
Power
Tata Power
Neutral
79
-
21,367
36,916
39,557
17.4
27.1
5.1
6.3
15.5
12.5
1.4
1.3
9.0
10.3
1.6
1.4
NTPC
Neutral
160
-
131,721
86,605
95,545
17.5
20.8
11.8
13.4
13.5
11.9
1.4
1.3
10.5
11.1
2.9
2.9
Power Grid
Neutral
183
-
95,947
25,763
29,762
74.3
73.1
14.8
17.3
12.4
10.6
1.9
1.7
16.9
17.5
8.0
7.6
Real Estate
MLIFE
Buy
432
522
1,773
1,152
1,300
22.7
24.6
29.9
35.8
14.5
12.1
1.1
1.0
7.6
8.6
2.3
1.9
Telecom
Bharti Airtel
Neutral
319
-
127,497
105,086
114,808
34.5
34.7
12.2
16.4
26.1
19.5
1.8
1.7
6.8
8.4
2.1
1.8
Idea Cellular
Neutral
84
-
30,265
40,133
43,731
37.2
37.1
6.4
6.5
13.1
12.9
1.1
1.0
8.2
7.6
1.8
1.5
zOthers
Abbott India
Neutral
4,615
-
9,806
3,153
3,583
14.1
14.4
152.2
182.7
30.3
25.3
148.9
127.1
25.6
26.1
2.8
2.4
Bajaj Electricals
Neutral
268
-
2,710
5,099
5,805
5.7
5.9
11.4
14.6
23.6
18.4
3.2
2.8
13.4
15.1
0.5
0.5
Finolex Cables
Neutral
424
-
6,492
2,883
3,115
12.0
12.1
14.2
18.6
29.9
22.8
15.9
13.9
15.8
14.6
1.9
1.8
Goodyear India*
Accumulate
579
631
1,335
1,598
1,704
10.4
10.2
49.4
52.6
11.7
11.0
54.1
47.5
18.2
17.0
0.5
69.4
Hitachi
Neutral
1,505
-
4,092
2,081
2,433
8.8
8.9
33.4
39.9
45.1
37.7
36.4
30.3
22.1
21.4
2.0
1.6
Jyothy Laboratories
Neutral
317
-
5,741
1,440
2,052
11.5
13.0
8.5
10.0
37.3
31.7
9.0
8.4
18.6
19.3
4.3
3.0
Page Industries
Neutral
15,198
-
16,951
2,450
3,124
20.1
17.6
299.0
310.0
50.8
49.0
338.5
258.4
47.1
87.5
7.0
5.5
Relaxo Footwears
Neutral
448
-
5,381
2,085
2,469
9.2
8.2
7.6
8.0
59.3
56.4
23.0
19.6
17.9
18.8
2.7
2.3
Siyaram Silk Mills
Neutral
1,329
-
1,245
1,799
2,040
11.6
11.7
104.9
122.4
12.7
10.9
2.1
1.8
16.4
16.4
0.9
0.8
Styrolution ABS India*
Neutral
569
-
1,001
1,440
1,537
9.2
9.0
40.6
42.6
14.0
13.4
35.8
32.5
12.3
11.6
0.7
0.6
TVS Srichakra
Accumulate
2,645
2,932
2,025
2,304
2,614
13.7
13.8
231.1
266.6
11.4
9.9
297.2
234.0
33.9
29.3
0.9
0.8
HSIL
Neutral
359
-
2,593
2,384
2,515
15.8
16.3
15.3
19.4
23.4
18.5
23.3
20.0
7.8
9.3
1.3
1.2
Kirloskar Engines India
Neutral
286
-
4,132
2,554
2,800
9.9
10.0
10.5
12.1
27.2
23.6
11.4
10.7
10.7
11.7
1.3
1.1
Ltd
M M Forgings
Neutral
429
-
518
546
608
20.4
20.7
41.3
48.7
10.4
8.8
58.8
52.0
16.6
17.0
0.8
0.7
Banco Products (India)
Neutral
238
-
1,704
1,353
1,471
12.3
12.4
14.5
16.3
16.4
14.6
22.7
20.4
14.5
14.6
1.2
129.1
Competent Automobiles Neutral
179
-
110
1,137
1,256
3.1
2.7
28.0
23.6
6.4
7.6
34.4
31.1
14.3
11.5
0.1
0.1
Nilkamal
Neutral
1,260
-
1,881
1,995
2,165
10.7
10.4
69.8
80.6
18.1
15.6
72.0
62.6
16.6
16.5
0.9
0.8
Stock Watch
September 06, 2016
Company Name
Reco
CMP
Target
Mkt Cap
Sales ( Čcr )
OPM(%)
EPS (Č)
PER(x)
P/BV(x)
RoE(%)
EV/Sales(x)
(Č)
Price ( Č)
( Č cr )
FY17E
FY18E
FY17E
FY18E
FY17E
FY18E
FY17E
FY18E
FY17E
FY18E
FY17E
FY18E
FY17E
FY18E
zOthers
Visaka Industries
Neutral
191
-
303
1,051
1,138
10.3
10.4
21.0
23.1
9.1
8.3
24.5
22.9
9.0
9.2
0.5
0.5
Transport Corporation of
Neutral
191
-
1,464
2,671
2,911
8.5
8.8
13.9
15.7
13.8
12.2
1.9
1.7
13.7
13.8
0.7
0.6
India
Elecon Engineering
Accumulate
58
63
636
1,482
1,660
13.7
14.5
3.9
5.8
15.0
10.1
3.5
3.2
7.8
10.9
0.7
0.7
Surya Roshni
Neutral
194
-
851
3,342
3,625
7.8
7.5
17.3
19.8
11.2
9.8
21.3
17.1
10.5
10.8
0.5
0.5
MT Educare
Neutral
138
-
548
366
417
17.7
18.2
9.4
10.8
14.7
12.7
3.3
2.8
22.2
22.3
1.4
1.2
Radico Khaitan
Buy
101
125
1,340
1,659
1,802
13.0
13.2
6.3
7.4
15.9
13.7
1.4
1.3
8.6
9.3
1.2
1.1
Garware Wall Ropes
Accumulate
478
524
1,046
873
938
12.9
13.1
30.9
34.9
15.5
13.7
2.4
2.1
15.7
15.2
1.1
1.0
Wonderla Holidays
Neutral
410
-
2,314
287
355
38.0
40.0
11.3
14.2
36.2
28.8
5.2
4.5
21.4
23.9
7.7
6.3
Linc Pen & Plastics
Neutral
280
-
414
382
420
9.3
9.5
13.5
15.7
20.8
17.8
3.6
3.1
17.1
17.3
1.2
1.0
The Byke Hospitality
Neutral
159
-
638
287
384
20.5
20.5
7.6
10.7
20.9
14.9
4.4
3.5
20.7
23.5
2.2
1.7
Interglobe Aviation
Neutral
871
-
31,369
21,122
26,005
14.5
27.6
110.7
132.1
7.9
6.6
47.1
33.6
168.5
201.1
1.5
1.1
Coffee Day Enterprises
Neutral
243
-
5,007
2,964
3,260
20.5
21.2
4.7
8.0
-
30.4
2.8
2.6
5.5
8.5
2.1
1.9
Ltd
Navneet Education
Neutral
104
-
2,477
1,062
1,147
24.0
24.0
6.1
6.6
17.1
15.7
3.5
3.1
20.6
19.8
2.4
2.2
Navkar Corporation
Buy
192
265
2,738
408
612
42.9
42.3
6.8
11.5
28.4
16.7
2.0
1.8
6.9
10.5
7.6
5.1
UFO Moviez
Neutral
476
-
1,314
619
685
33.2
33.4
30.0
34.9
15.9
13.7
2.2
1.9
13.8
13.9
1.8
1.5
VRL Logistics
Neutral
291
-
2,652
1,902
2,119
16.7
16.6
14.6
16.8
20.0
17.3
4.4
3.8
21.9
22.2
1.5
1.3
Team Lease Serv.
Neutral
1,113
-
1,903
3,229
4,001
1.5
1.8
22.8
32.8
48.9
33.9
5.2
4.5
10.7
13.4
0.5
0.4
S H Kelkar & Co.
Neutral
341
-
4,937
1,036
1,160
15.1
15.0
6.1
7.2
55.9
47.6
6.0
5.5
10.7
11.5
4.6
4.1
Quick Heal
Neutral
237
-
1,661
408
495
27.3
27.0
7.7
8.8
30.6
27.0
2.8
2.9
9.3
10.6
3.2
2.7
Narayana Hrudaya
Neutral
312
-
6,370
1,873
2,166
11.5
11.7
2.6
4.0
117.9
78.6
7.2
6.5
6.1
8.3
3.5
3.0
Manpasand Bever.
Neutral
737
-
3,686
836
1,087
19.6
19.4
16.9
23.8
43.6
30.9
5.2
4.6
12.0
14.8
4.2
3.1
Parag Milk Foods
Neutral
339
-
2,848
1,919
2,231
9.3
9.6
9.5
12.9
35.9
26.2
5.6
4.6
15.5
17.5
1.6
1.4
Source: Company, Angel Research; Note: *December year end; #September year end; &October year end; Price as on September 02, 2016
Market Outlook
September 06, 2016
Research Team Tel: 022 - 39357800
DISCLAIMER
Angel Broking Private Limited (hereinafter referred to as “Angel”) is a registered Member of National Stock Exchange of India
Limited,Bombay Stock Exchange Limited and Metropolitan Stock Exchange Limited. It is also registered as a Depository Participant with
CDSL and Portfolio Manager with SEBI. It also has registration with AMFI as a Mutual Fund Distributor. Angel Broking Private Limited is a
registered entity with SEBI for Research Analyst in terms of SEBI (Research Analyst) Regulations, 2014 vide registration number
INH000000164. Angel or its associates has not been debarred/ suspended by SEBI or any other regulatory authority for accessing
/dealing in securities Market. Angel or its associates/analyst has not received any compensation / managed or
co-managed public offering of securities of the company covered by Analyst during the past twelve months.
This document is solely for the personal information of the recipient, and must not be singularly used as the basis of any investment
decision. Nothing in this document should be construed as investment or financial advice. Each recipient of this document should make
such investigations as they deem necessary to arrive at an independent evaluation of an investment in the securities of the companies
referred to in this document (including the merits and risks involved), and should consult their own advisors to determine the merits and
risks of such an investment.
Reports based on technical and derivative analysis center on studying charts of a stock's price movement, outstanding positions and
trading volume, as opposed to focusing on a company's fundamentals and, as such, may not match with a report on a company's
fundamentals. Investors are advised to refer the Fundamental and Technical Research Reports available on our website to evaluate the
contrary view, if any.
The information in this document has been printed on the basis of publicly available information, internal data and other reliable
sources believed to be true, but we do not represent that it is accurate or complete and it should not be relied on as such, as this
document is for general guidance only. Angel Broking Pvt. Limited or any of its affiliates/ group companies shall not be in any way
responsible for any loss or damage that may arise to any person from any inadvertent error in the information contained in this report.
Angel Broking Pvt. Limited has not independently verified all the information contained within this document. Accordingly, we cannot
testify, nor make any representation or warranty, express or implied, to the accuracy, contents or data contained within this document.
While Angel Broking Pvt. Limited endeavors to update on a reasonable basis the information discussed in this material, there may be
regulatory, compliance, or other reasons that prevent us from doing so.
This document is being supplied to you solely for your information, and its contents, information or data may not be reproduced,
redistributed or passed on, directly or indirectly.
Neither Angel Broking Pvt. Limited, nor its directors, employees or affiliates shall be liable for any loss or damage that may arise from
or in connection with the use of this information.